
Last Tuesday, September 22nd, I attended a community meeting downtown at Cannery Hall to review the substitute text for BL2026-1497. This bill, which was originally broader in scope but then limited after receiving feedback as well as the seal of approval from NDOT, includes a plan to roll out No Turn on Red (NTOR) signage for high incident intersections in phases. The first phase is relatively immediate with 59 intersections, the majority of which is in the downtown core, with a follow up phase to study some 300 more intersections to identify additional problematic crossing areas, giving particular attention to common spaces such as schools and hospitals.
Ostensibly, the meeting was dually hosted by Council Member (CM) Sandra Sepulveda of District 30, the sponsor of the bill, and by CM Jacob Kupin of District 19, which includes downtown Nashville. CM Sepulveda opened the community meeting by providing some background on the bill including the bill’s progression through council, its evolution with NDOT, that NTOR has been a recommendation for pedestrian safety for decades without full implementation and pointed to other cities’ success with regards to safety when implementing their own pilots.
With Kupin’s portion of the presentation, however, the tone of the meeting became immediately confrontational. An eagle-eyed attendee, Ben Vaught, noted after a DZL logo, the owner of Cannery Hall, in the top right corner of Kupin’s portion of the presentation, which negatively framed the initiative. It stated, “Nashville already has authority to implement NTOR where warranted. The question is whether BL2026-1497 improves upon, or unnecessarily constrains, that existing engineering process and whether NDOT has produced sufficient data to justify a blanket NTOR policy at 59 intersections in downtown.”
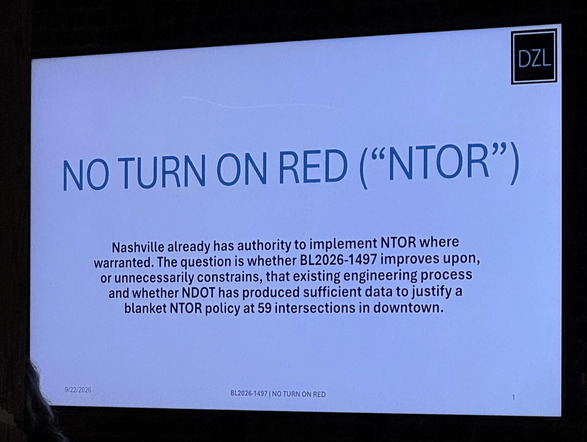
Credit: @benvaught.bsky.social
While the first part of that statement is true, NDOT already has the authority to implement NTOR, it has not, to reiterate, been implemented in a planned, strategic manner throughout the city, hence the purpose of the bill. To the second part, the question is not whether the legislation improves upon the process or constrain traffic downtown. This is not the question because NTOR has been a recommendation since 2003 in numerous Metro plans time and again. The question, rather, is why haven’t they done it yet. The answer to that question lies with the presence of the DZL logo in a CM’s presentation.
As mentioned, DZL owns, among other downtown properties, Cannery Hall where the meeting was held. Two of the very loudest voices in the room were owner Zach Liff and Chief Investment Officer Aaron Breeden. Following NDOT’s portion of the presentation on how they came to identify the 59 locations for NTOR there was a barrage of questions from them and a few others on the validity of their conclusions. They questioned things like whether the lights were actually red or if pedestrians were actually in the crosswalk. Someone suggested more signage aimed at pedestrians rather than NTOR for vehicles. All of this was a Gish gallop to frame NTOR as a problem rather than a solution.
But I digress as the DZL logo in a council member’s presentation with obvious negative framing really gives the game away. That is to say the purpose of the CM Kupin’s community meeting was to provide a platform for DZL and possibly other confederate attendees in the audience to make the measure seem more contentious than it may actually be compared to, say, a community meeting held in a library or community center more open to the general public rather than the top floor of a private business.
To be completely honest, I didn’t notice the logo at the time nor was I familiar with DZL prior Vaught pointing it out. I wouldn’t be able to pick Liff or Breeden out of a line up prior to that meeting, and maybe they were banking on that. Local news outlets certainly didn’t pick up on it either as they didn’t ask why it appeared that a local business was providing a presentation and its talking points to a local council member.
When it was pointed out, I did find it insulting. It shows how brazen, and I would even say with a tinge of laziness, the audacity present in the room was for a small subset of Nashvillians who, wealthy as they may be, felt they were entitled to put their thumb on the scale of policy that impacts so many of us downtown.
That then, to come full circle, is the answer to the question of why NTOR hasn’t yet been implemented systematically downtown. Codifying NTOR in city statute makes it more difficult for NDOT, or individual council member pressuring NDOT, or business interests pressuring council members to pressure NDOT to remove them. We have seen this with removal of benches on Korean Veterans Boulevard and the installation of hostile architecture as well as bulb-outs and other traffic calming measures among other examples.
It’ a problem and BL2026-1497 is a solution. It’s certainly not the only one, but its definitely one to address this dire situation.
But What Does the Data Say, Really?
What can I say? I’m a sucker for digging into data. But I’m also not stupid. Let’s board the WeGo Star to the Land of Make Believe and imagine their concerns are in good faith. With the help of Metro Nashville’s publicly available data, we should get a good sense if NTOR is good policy for Nashville.
Data Collection
Using Metro Nashville’s Open Data Portal and the Council’s Legistar portal, a few key, though imperfect, data points can be collected:
1) Traffic incident data from the Open Data Portal that includes pedestrians, cyclists, and “other type non-motorist,” which seems to include methods such as e-scooters given their prevalence in mid-town, downtown, and East Nashville.
2) Crosswalk locations from the Open Data Portal, which, while imperfect, are a useful proxy to look at the Urban Services District as that is primary area they cover.
3) Proposed NTOR signage locations as mentioned in BL2026-1497 from Legistar, Metro Nashville’s depository for council legislation.
A few caveats, the data NDOT analysts would have access to would be much more refined than just what is available via MNPD accident records on the Open Data Portal. They appeared to include a technical form of “conflict” that included but also went beyond reported incidents with MNPD. It also should be mentioned that crosswalks are not the same as intersections as all intersections can be crossed but may not have dedicated crosswalks. In addition to point number three made above, crosswalks provide a useful point on a map for geospatial analysis. There are probably others I’m not privy to as I don’t work in NDOT or with their data, but, again, this is to see if this moves us in their direction.
Data Cleaning
Data cleaning focused on filtering for any incident involving the three parties mentioned above: pedestrians, cyclists, and other type non-motorists. Legistar did not provide latitude and longitude for the NTOR signage, only cross streets. This was collected using Google Maps. Data was then filtered for the last five years, which the NDOT representative stated was one of their metrics for analysis.
For an initial pass, this information was plotted in Google Maps. One set looked at all MNPD reported incidents, of which there were 2,679. For a sense of comparison, another Google Map was created where an injury or fatality was involved with 2,560 incidents (or 95%) reported by MNPD. This is helpful for a high-level overview, sense of scale, and for poking around on a map, but it doesn’t get to the question of if NTOR is warranted both at these initial 59 locations in Phase 1 or beyond for Phase 2. To do so, we would need link the proximity of MNPD reported accidents to the proposed NTOR signage as well as other crosswalks in Nashville.
Measuring four-lane crosswalks on Broadway, their lengths were typically around 50 feet, so this was used to collect accident data in proximity to proposed NTOR signage and crosswalks to provide data for the entire intersection. As an additional buffer, particularly in cases where intersections where wider such as in cases where wide roads include multiple turning lanes, accident data was collected 100 feet in proximity to the proposed NTOR signage and crosswalks.
To account for some noise in the data, accident data was limited to within 1000 ft of NTOR signage or crosswalk, or a little less than a quarter mile. This allowed for two things: 1) it eliminated accident data outside of the USD, where BL2026-1497 focuses, and 2) it allowed to account for where a crosswalk would potentially be available, being within a five-minute walk or less, but someone to cross in the middle of the street. Let’s say that one is for the naysayers.
Figure 1: Accidents More than a 1000 Ft from a Crosswalk, Zoomed into Nashville’s Urban Core
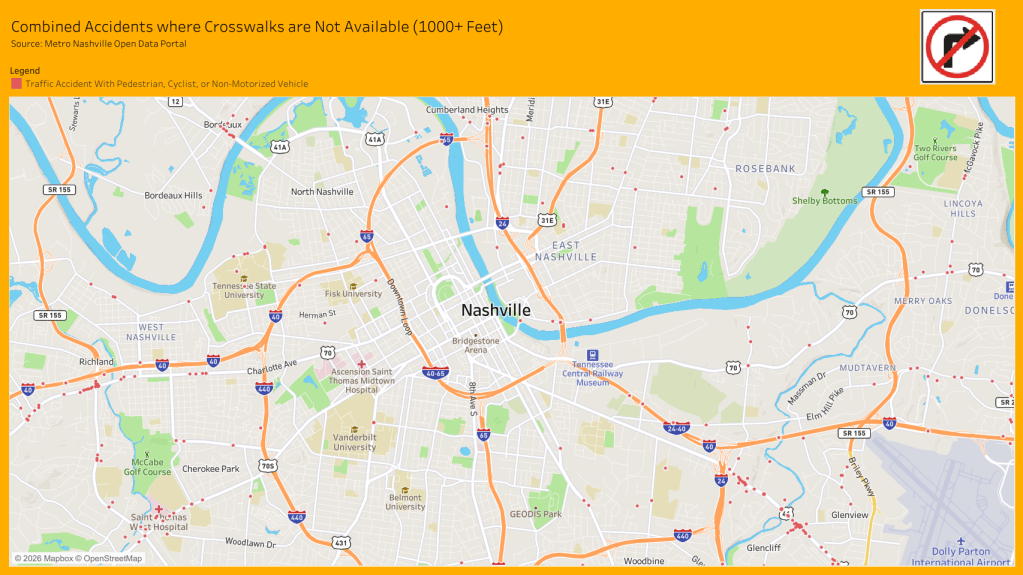
Figure 1 provides a sense of scale for such accidents that occur 1000+ feet from a crosswalk in the urban core. Inside the 40/65/24 loop, there’s four accidents clearly within its perimeter and two more right there on the line. That’s how broad crosswalk coverage is downtown. Similar things can be said for the urban core. So, the parameters are sound and should capture the majority of accident data in the USD and almost all of it for downtown specifically.
Within the two broad parameters of 1) accidents including pedestrians, cyclists, and non-motor vehicles within 2) 1000 feet of a crosswalk, there are a total of 1,286 reported accidents in the last five years. That’s out of an initial set of 2,679, mind you, so 48%.
Figure 2: For Context, All Reported Incidents (Fuchsia) with Pedestrians, Cyclist, and E-Scooter-Type Transportation, Proposed NTOR Signage (Teal), and Crosswalks (Goldenrod) in the data set from Nashville’s Open Data Portal
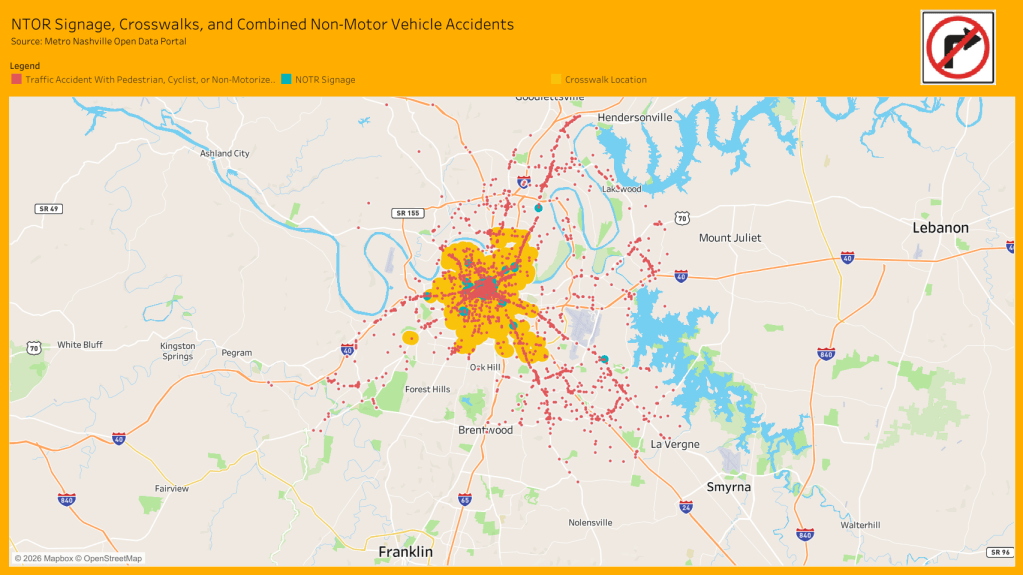
Wow, look at that big fuchsia blob in the center of town. It’s like there’s a lot going on there. Let’s dig in.
You can see all the maps and stats shared here on some dashboards I created on Tableau Public here, but we’ll begin with an overview of this accident data within 50 feet of NTOR signage and crosswalks.
Findings Highlight – Within 50 Feet of NTOR Signage and Crosswalks
Figure 3: Reported Incidents (Fuchsia) with Pedestrians, Cyclist, and E-Scooter-Type Transportation Within 50 Ft of Proposed NTOR Signage (Teal) in Nashville
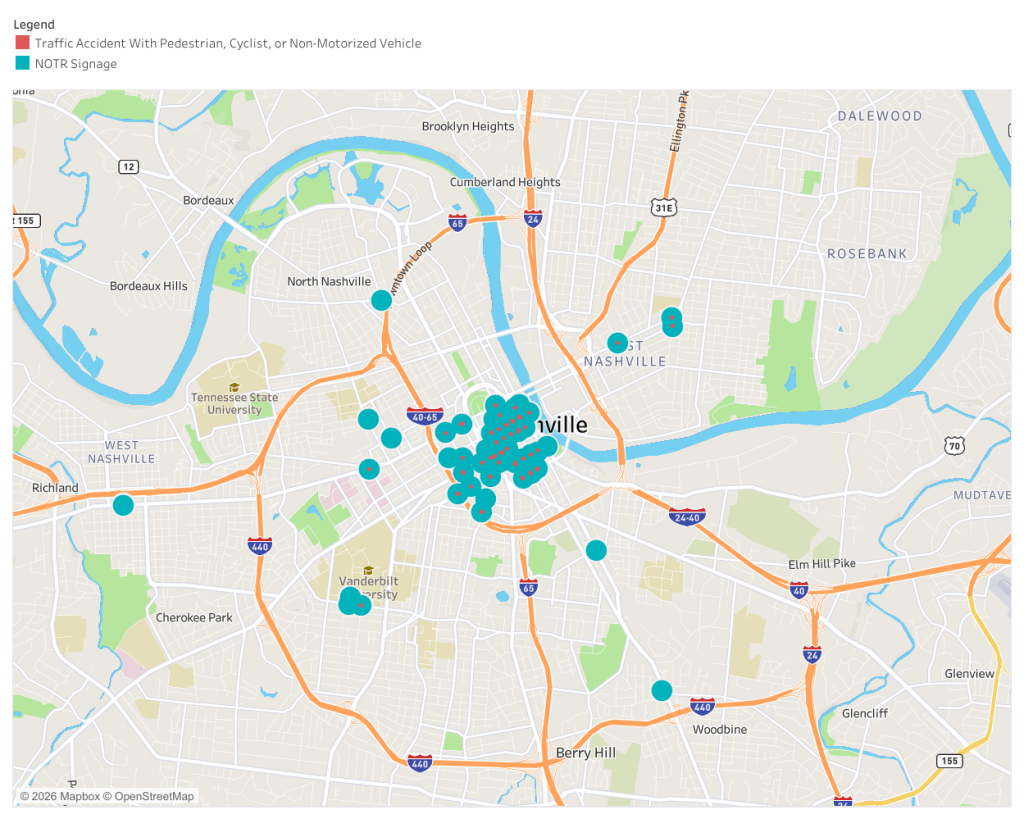
There are 146 MNPD-reported incidents that took place at least 50 feet from the proposed 59 intersections for NTOR signage (that’s about 30 on average a year for those doing mental math right now). Out of the 59, 43 (72%) had at least one incident occur within 50 feet. But before the naysayers say, “72%? That’s not 100%. See, I told you so.” remember that this is just from publicly available data from MNPD. NDOT’s analysis will be far more refined.
That being said we can also have a more refined assessment of their effect downtown with the tools at hand. By create a filter of 0.7 miles from a proposed NTOR location, specifically Broadway and 6th, we can isolate the locations in that area of downtown. In total, there were 444 reported accidents within 50 feet of a crosswalk. Here are the results.
Figure 4: Reported Incidents (Fuchsia) with Pedestrians, Cyclist, and E-Scooter-Type Transportation Within 50 Ft of Proposed NTOR Signage (Teal), Filtered for Proximity to NTOR in Downtown Nashville
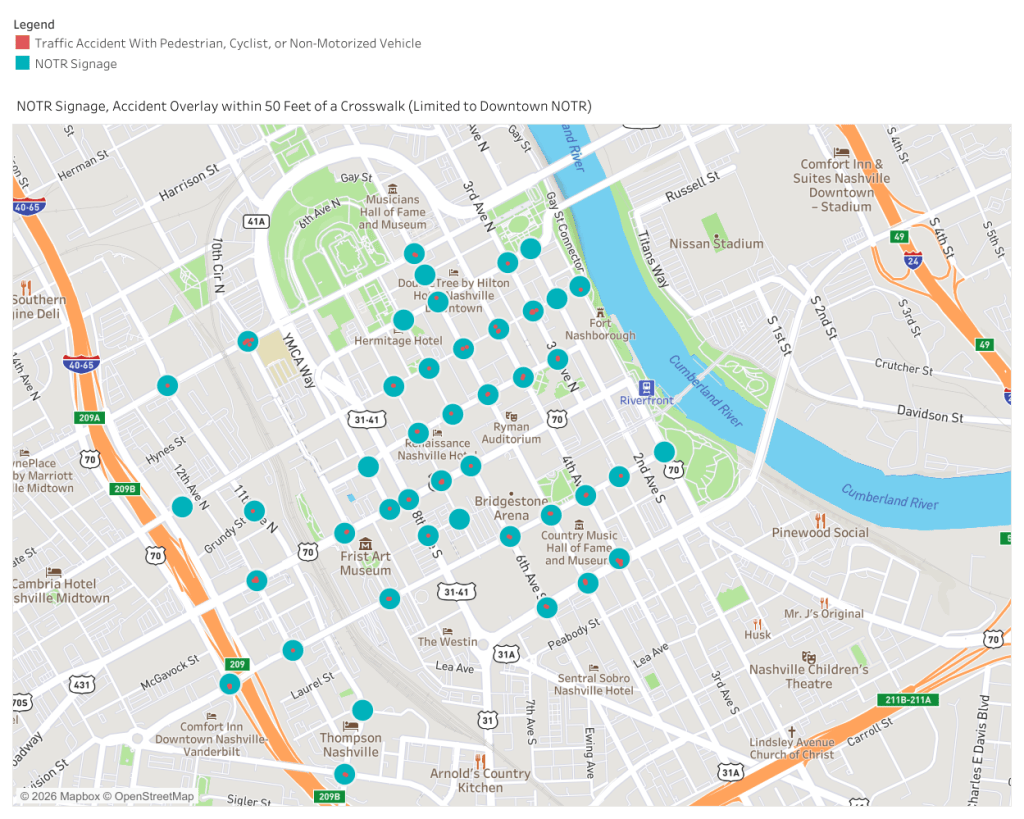
There are multiple proposed NTOR signage sites with 2, 3, 4, even 5 reported incidents. Here are just a few examples:
- Broadway and 10th Ave S.: 5 incidents
- Broadway and Rosa Parks: 6 incidents
- Broadway and 7th Ave S: 4 incidents
- John Lewis and Demonbreun St: 3 incidents
- John Lewis and Korean Veterans Blvd: 5 incidents
- Korean Veterans and 4th Ave S.: 4 incidents
And on, and on, and on.
So, yes, even with this limited data, these 59 NTOR signage seems to be good, targeted policy despite the whining from downtown business interests who would like to get to work in their automatic Porsche Cayenne just a fraction of their time faster. The better question is, does this go far enough? If not, what intersections should be targeted for Phase 2. Well, expanding the view to include all crosswalks, you tell me…
Figure 5: Reported Incidents (Fuchsia) with Pedestrians, Cyclist, and E-Scooter-Type Transportation Within 50 Ft of Crosswalks (Goldenrod) or NTOR Signage (Teal)
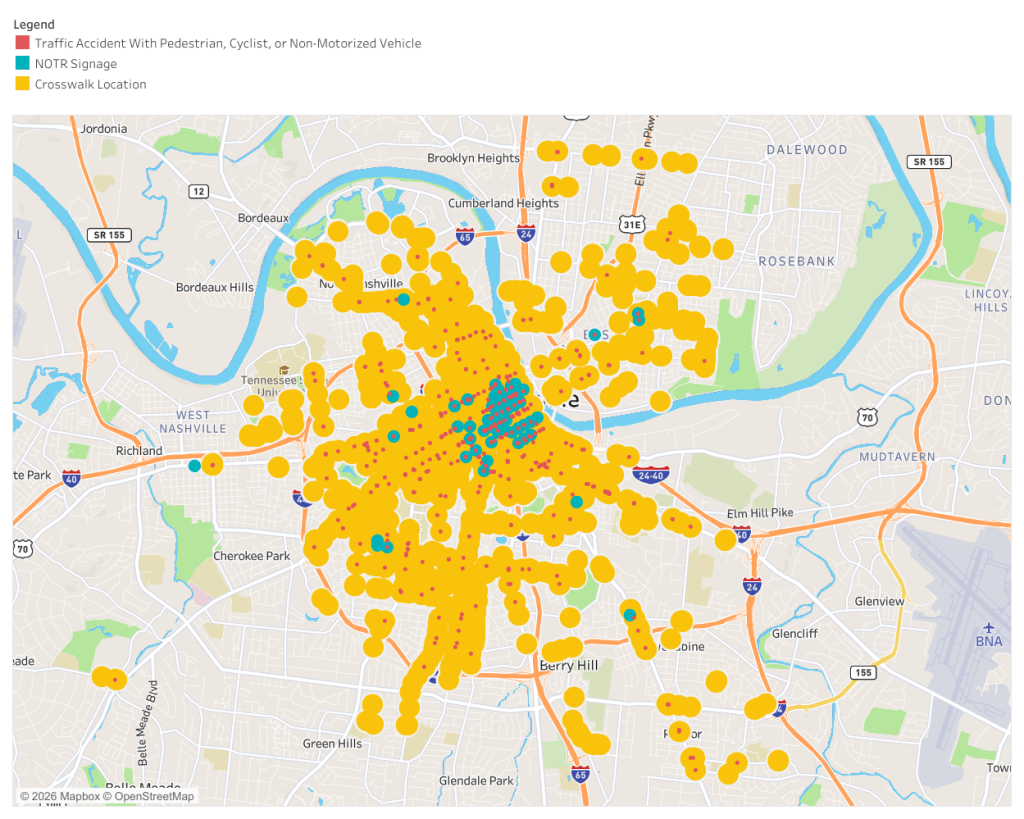
This view doesn’t even include all the locations, but there are 594 incidents that took place within 50 feet of a crosswalk or proposed NTOR signage (118 on average per year). With 146 of them within proposed NTOR signage alone, there are 448 incidents (~90 incidents a year) that took place outside of proposed NTOR locations in Phase 1 but within proximity to a crosswalk that could be possible candidates for Phase 2. And, again, I can’t stress this enough, that this is from limited MNPD-reported data alone.
But let’s look at downtown Nashville again.
Figure 6: Reported Incidents (Fuchsia) with Pedestrians, Cyclist, and E-Scooter-Type Transportation Within 50 Ft of Crosswalks (Goldenrod) or NTOR Signage (Teal), Filtered for Proximity to NTOR in Downtown Nashville
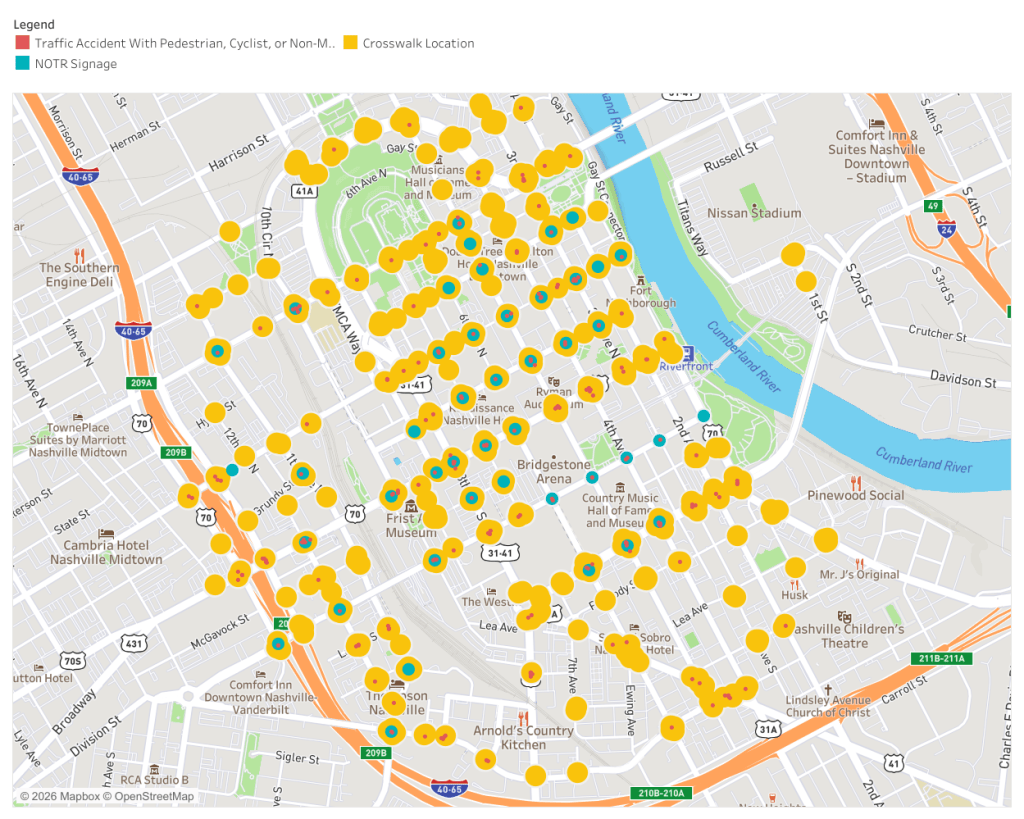
Look at all the accidents at crosswalks where there is no proposed NTOR signage.
What strikes me immediately is Lower Broadway on the right. Several goldenrod dots, many many fuchsia, and no teal. Some examples:
- Broadway and John Lewis: 5 incidents
- Broadway and 4th: 10 incidents
- Broadway and 3rd: 6 incidents
And that’s just Lower Broadway.
Looking outside of specific intersections and at the broader picture, here is a breakdown of total accident data, injury data, and fatalities for those outside of a car within 50 feet of a crosswalk:
- As a reminder, there are a total of 1,286 reported accidents represented here.
- 594 (46%) of accidents with pedestrians, cyclists or other non-motor vehicles occurred within 50 ft of a crosswalk.
- 581 of those 594 incidents resulted in injuries, with many being multiple individuals, with 47% of total incidents with injuries occurring 50 ft from a crosswalk compared to those that weren’t. In total, 630 people were injured 50 ft from crosswalks.
- 15 (2.5%) incidents of those 594 resulted in fatalities (all individual deaths) with 26% of total deaths (58) occurring 50 ft from crosswalks. 3 of those 15 deaths (20%) occurred at proposed NTOR signage.
- 123 (21%) accidents of the 594 were within 50ft of a crosswalk were at the proposed NTOR signage.
And here is that same breakdown, but filtered for proximity to the proposed NTOR in downtown Nashville alone.
- With this filter, there are 444 reported accidents represented.
- 276 (62%) of accidents with pedestrians, cyclists or other non-motor vehicles occurred within 50 ft of a crosswalk.
- 272 of those 276 incidents resulted in injuries, with many being multiple individuals, with 62% of total incidents with injuries occurring 50 ft from a crosswalk compared to those that weren’t. In total, 295 people were injured 50 ft from crosswalks.
- 9 (2%) incidents of those 276 resulted in fatalities (all individual deaths) with 56% occurring 50 ft from crosswalks. 3 of those 9 deaths (33%) occurred at proposes NTOR signage.
- 111 (40%) accidents of the 276 within 50 ft of a crosswalk were at the proposed NTOR signage in downtown Nashville alone.
Let’s compare this accident data in downtown to that within 50 feet of all crosswalks
- There are 444 reported accidents in downtown compared to 1,286 for all crosswalks. 35% took place downtown.
- For all accidents involving pedestrians, cyclists or other non-motor vehicles within 50 ft of a crosswalk, 276 took place downtown compared to 594. 46% occurred downtown.
- 9 such accidents occurred downtown compared to 15 within all crosswalks. 60% occurred downtown.
- 111 accidents occurred at a proposed NTOR signage downtown compared to 123 at all NTOR signage. That’s 90%.
As mentioned, this data was also calculated for incidents within 100 feet of proposed NTOR signage and crosswalks. For the sake of length, I will leave the reader to review the maps and full data breakdowns on the Tableau Public dashboards, but here are the bullet points:
- Total number of accidents represented remains the same: 1,286
- 716 (56%) of accidents with pedestrians, cyclists or other non-motor vehicles occurred within 100 ft of a crosswalk within these parameters.
- 698 of those 716 incidents resulted in injuries with 57% of incidents with injuries occurring at 100 ft from crosswalks. In total, 761 people were injured within 100 ft of a crosswalk.
- 20 (2.7%) of those 716 resulted in fatalities with 34% occurring 100 ft from crosswalks. Those same 3 deaths of 20 (15%) occurred at proposed NTOR signage.
- The number of accidents within 100 ft of NTOR is the same, so 123 (17%) of the 716 accidents within 100ft of a crosswalk were at the proposed NTOR signage.
Conclusion
In short, the naysayers are wrong and they, frankly, are selfish in their reasoning. They are more worried about congestion, that is, their own convenience, rather than their community’s safety when the data clearly shows there will be a demonstrable positive impact for those walking and riding the streets outside of a personal vehicle.
Here, I’m estimating between a 17-21% reduction in accidents at crosswalks involving pedestrians, cyclists and people on other alternative forms of transportation such as e-scooters at the proposed NTOR crosswalks based on MNPD’s accident data alone. In downtown alone, that figure doubles to around a 40% reduction.
It is quite likely then that the before and after accident figures at these proposed NTOR locations would be much higher, and NTOR pilots in other cities back this up. A pilot to restrict RTOR in DC decreased vehicle-pedestrian and vehicle-vehicle conflicts by 92% and 97% respectively in the area. Similar results were found in a San Francisco pilot. Furthermore, when right on red was legalized 50 years ago in response to the 1970s gas crisis, pedestrian and cyclist involved crashes increased exponentially into the double and triple digits. It should be unsurprising when that trend is reversed with NTOR. It should be no surprise that NTOR has seen positive results in Nashville in the limited cases its been used. As reported by the Tennessean,
But there were also some examples shared of where limits to right turns at red lights already appear to be working in Nashville. Williams said throughout the county from the start of 2025 through Aug. 3, 2026, there were just four crashes involving a pedestrian or bicyclist being hit by a driver reported at intersections where turning right on red is already forbidden, compared to 49 at intersections where right turns on red are permitted.
Four accidents with pedestrians or cyclists where NTOR already exists in Nashville compared to 49 where it isn’t. That’s a 92% decrease by comparison. The same number as DC. I mean, c’mon….
It’s just not a debate anymore. The data is just not on the side detractors. It wasn’t when right on red was first introduced 50 years ago and it’s not today.
CM Sepulveda is right. NDOT is right. The big whiny boo boo boss babies downtown are wrong and no amount of special community meetings for them to share their big strong feelings on the matter will make them right.
Period. End of Story. So it’s time to turn the page on the matter.
BL2026-1497 should pass and NTOR will help keep pedestrians, cyclists, and others on the streets safer, without injury, and likely alive.
I’d make a good bet with some people at DZL on that one. Let’s say the deed to Cannery Hall.

Leave a comment